Advanced: profiling GPU code with Nsight Systems
![]()
nvidia-smi used in previous episodes tells you whether your GPU is being used — Nsight Systems tells you why it isn't being used
as much as it should be. It produces a detailed timeline of CUDA kernel execution, memory transfers between
host and device, and CPU-side activity, making it possible to pinpoint bottlenecks such as data loading stalls,
excessive host–device transfers, or poorly overlapping compute and I/O.
The cluster workflow

Nsight Systems has no display requirement at the collection stage. The profiler runs entirely from the command line
inside your batch job and writes a self-contained .nsys-rep report file, which you then download and open in the
Nsight Systems GUI on your local machine. Install the GUI on your laptop from the NVIDIA Nsight Systems download page.
Instrumenting your batch script
#!/bin/bash

#SBATCH --job-name=nsys-profile
#SBATCH --partition=gpu_inter
#SBATCH --gres=gpu:1

# CUDA module provides the nsys binary
module load CUDA/12.6.0

# Prefix your Python invocation with nsys profile:
nsys profile \
  --output=profile-${SLURM_JOB_ID} \
  --trace=cuda,nvtx,osrt \
  --cudabacktrace=true \
  python3 train.py
This produces profile-<JOBID>.nsys-rep in your working directory. The --trace flags control what is captured — cuda
for kernel and memory transfer timelines, nvtx for any manual annotation ranges you add (see below), and osrt for
OS runtime calls such as sleep and pthread activity.
Example
The following short PyTorch script deliberately includes a common inefficiency — repeated small host-to-device transfers inside the training loop — so the profiler has something interesting to show:
import torch
import torch.nn as nn

device = torch.device("cuda")

model = nn.Sequential(
    nn.Linear(1024, 2048),
    nn.ReLU(),
    nn.Linear(2048, 1024),
).to(device)

# Inefficient: data moved to device inside the loop on every step
for step in range(200):
    x = torch.randn(64, 1024)          # created on CPU
    x = x.to(device)                   # transferred each iteration
    loss = model(x).sum()
    loss.backward()
In the Nsight Systems timeline you will see a recurring pattern of short cudaMemcpy calls (host→device) preceding
each forward pass kernel, with the GPU sitting idle during the transfer. Moving x = torch.randn(64, 1024, device=device) outside the loop eliminates these transfers and the idle gaps disappear.
Adding NVTX annotations
For longer scripts it is useful to label regions of your code so they appear as named spans in the timeline:
import nvtx

with nvtx.annotate("data loading", color="blue"):
    x = x.to(device)

with nvtx.annotate("forward pass", color="green"):
    loss = model(x).sum()
nvtx is available via pip install nvtx. The named spans appear as coloured bars in the Nsight Systems timeline directly above the CUDA activity, making it easy to correlate your code structure with GPU behaviour.
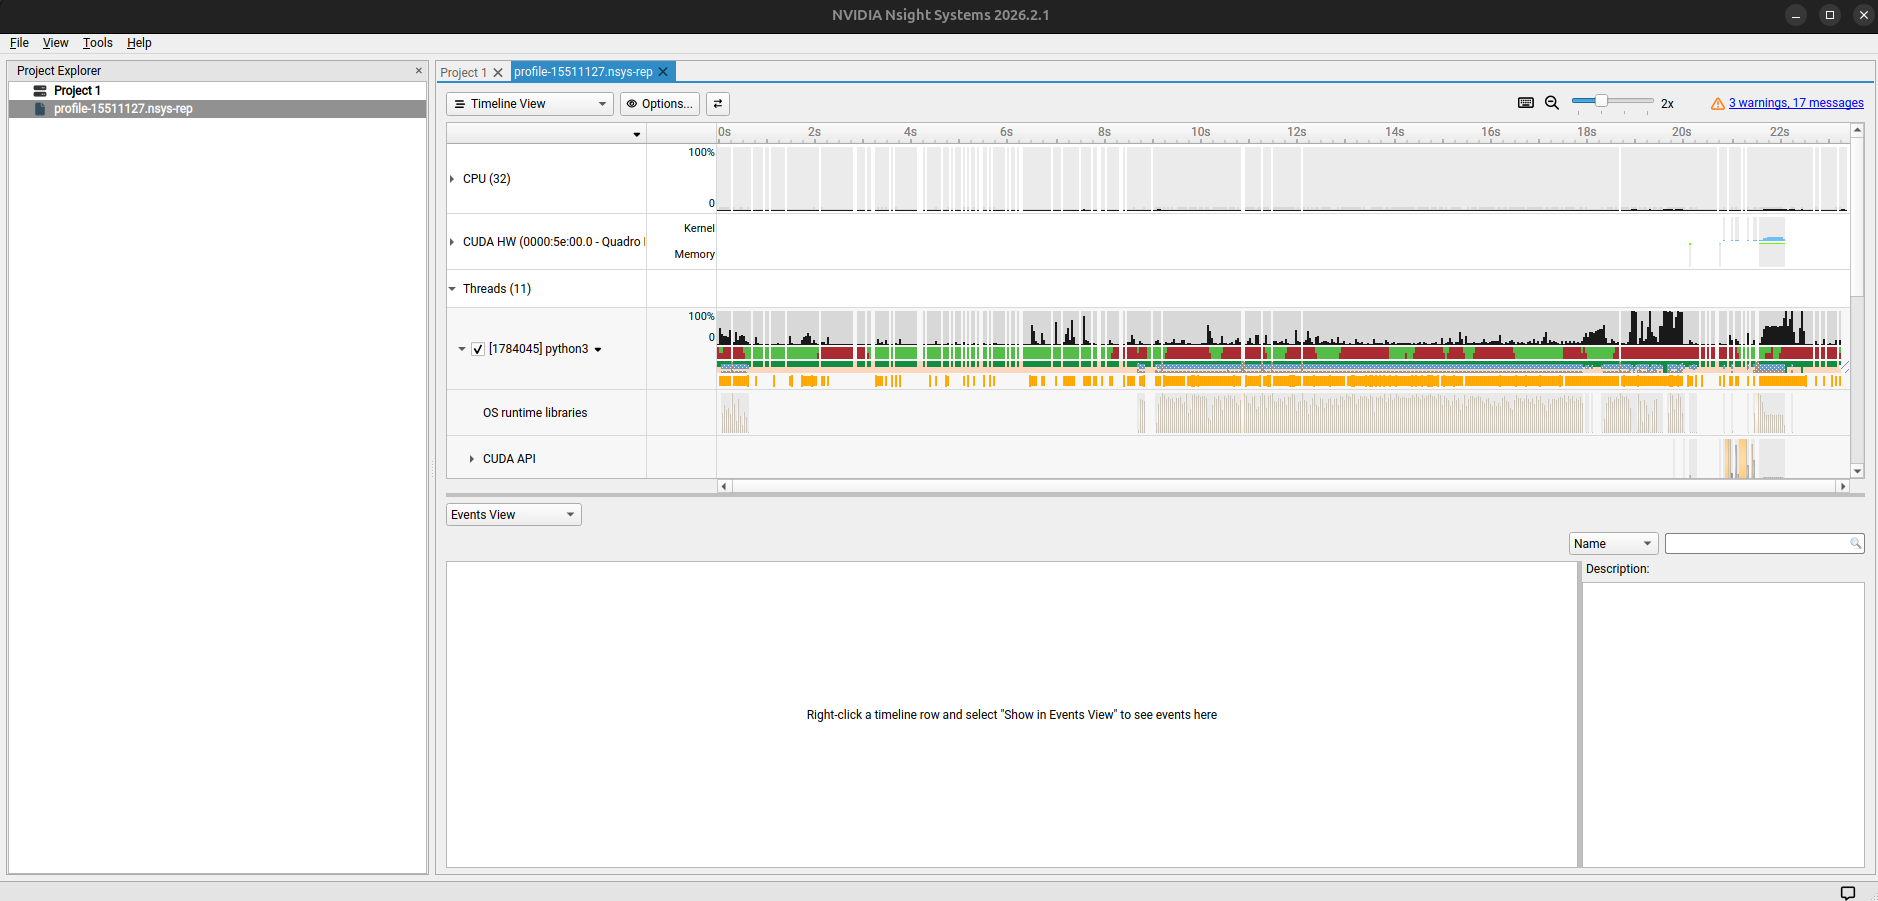
Viewing the report
-
Copy the
.nsys-repfile to your local machine: -
Open it in the Nsight Systems GUI. The main view is a timeline with rows for CUDA API calls, kernel execution, memory operations, and NVTX ranges. Key things to look for:
- Gaps in the CUDA row — the GPU is idle, usually waiting on the CPU or a data transfer
- Long c
udaMemcpyspans — excessive host–device transfers - Short, fragmented kernels — the overhead of launching many small kernels may outweigh their compute
For kernel-level analysis (occupancy, memory bandwidth, warp efficiency) the companion tool ncu (Nsight Compute) goes deeper, though it is significantly slower to collect and is usually the second step after identifying the bottleneck kernel with Nsight Systems first.